
Figure 1: RURAL POPULATION ... Ratio of employed people to 15 years old and older population

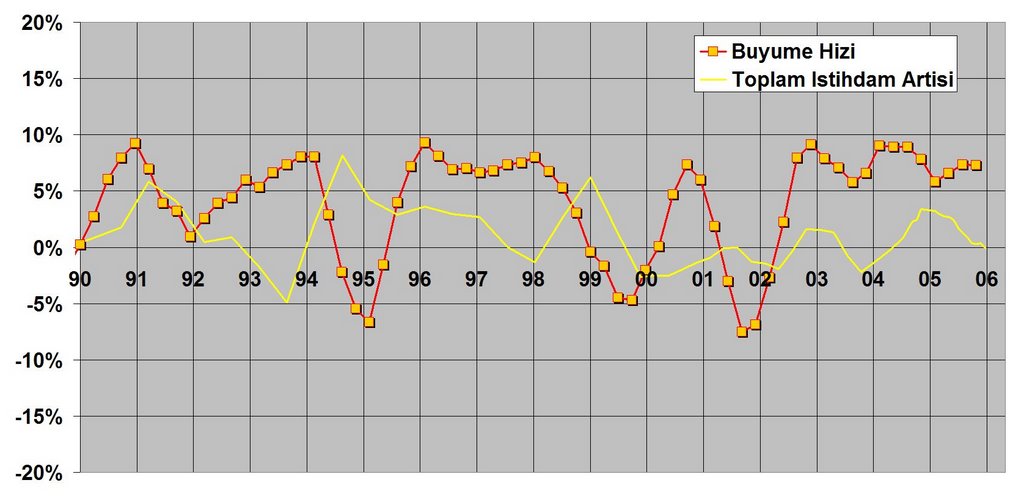
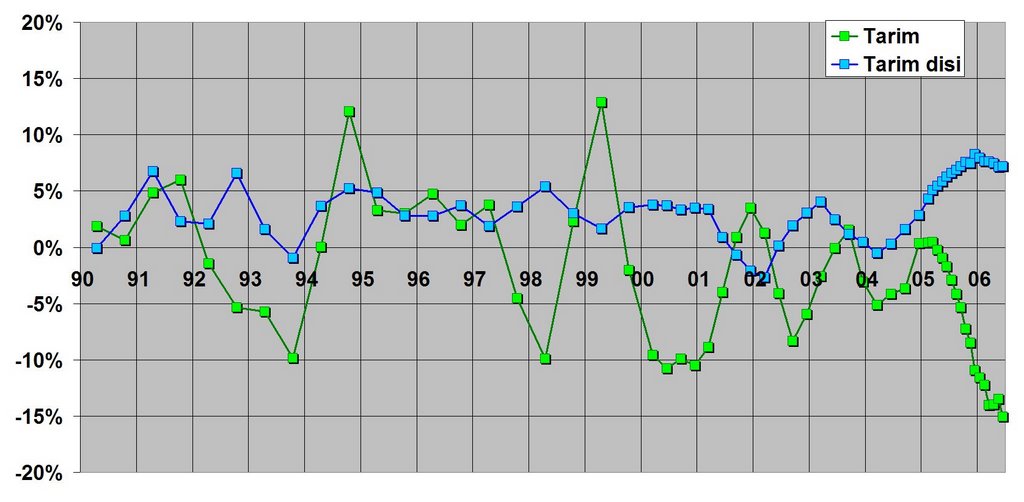
Two questions come to my mind: Are we witnessing a radical structural change in the job market? Is there something wrong with the statistics on agricultural employment valid?
The numbers are suspicious for the following reason: Almost all positive growth rates in agricultural employment came when the economy is in recession: 1991, 1994, 1999, 2001. Is it possible that those people who supposedly work in the agriculture sector realy work or they just return to their villages when the economy is in trouble?
Let's look at the simple correlation between the variables, first: :
Employment Growth in Agriculture vs. Production Growth in Agriculture: 0.02
Growth in Nonfarm Employment vs. Growth in Nonfarm Production: 0.26
Employment Growth in Agriculture vs. Growth in Nonfarm Production: -0.42
Let's put the numbers in a chart, where this negative relationship between nonfarm production growth (y-axis) and agricultural employment growth (x-axis) is easily observable: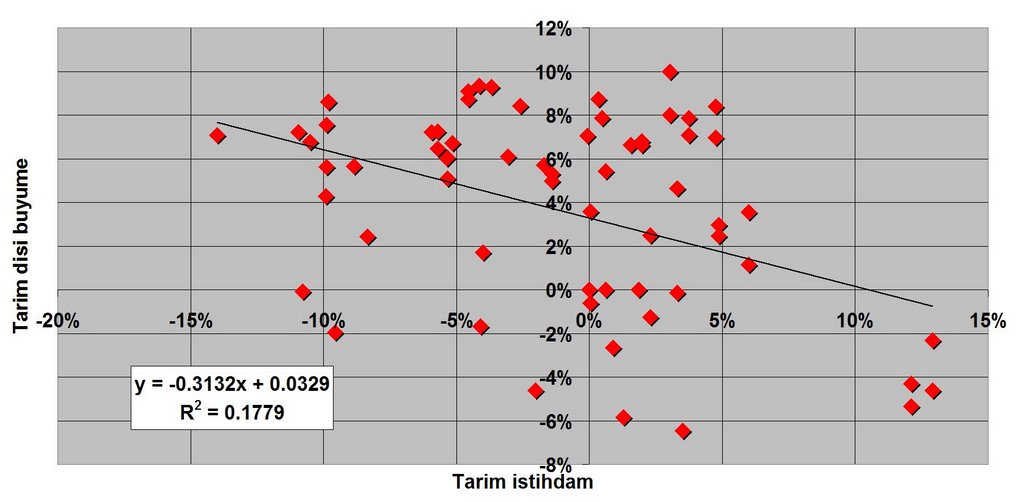
Lesson 1: Better to look at nonfarm employment because there is something fishy in agricultural employment data.
In the next graph, we look at the relationship between nonfarm employment growth (blue line) and nonfarm production growth (red line). The link is more stable and significant, but still there is something wrong with the figure. In particular, look at 1994 and 1999. Although the country fell into depression in these periods, the economy continued to create nonfarm jobs!!! How can this be possible?

My explanation is the changes in the household survey (the only data source on employment in Turkey), especially in the sample size and the methodology.
The State Institute of Statistics started to conduct households surveys on a bi-annual basis in 1988. In 2000 the HH survey methodology was updated (sample size was doubled, and the coverage was extended to other regions of the country). Between 2000 and 2005 survey cycle was reducted from 6 to 3 months. In 2005 the HH survey was updated once again to make it compatible with Eurostat standards. Number of regions covered was raised from 7 to 26 and sample size by 50%. Starting in Jan2005, HH survey has conducted each month.
Lesson 2: You can rely more on 2000-2005 numbers than 1998-2000, and more on 2005- numbers than 2000-2005.
Let's focus on 2000-2006 period and update our simple correlation table:
Employment Growth in Agriculture vs. Production Growth in Agriculture: -0.40
Growth in Nonfarm Employment vs. Growth in Nonfarm Production: 0.60
Employment Growth in Agriculture vs. Growth in Nonfarm Production: -0.37
And also update the previous figure as well (nonfam job growth on the x-axis, nonfarm production growth in the y-axis):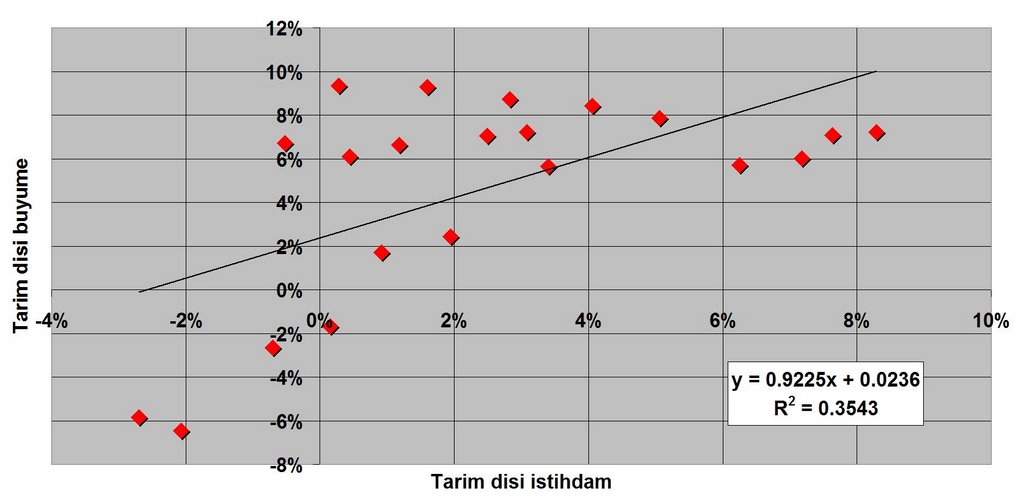
This is the picture of so-called "jobless growth".
Data Source


