Google
 
Showing posts with label Growth. Show all posts

Thursday, June 07, 2007

Fast and Furious !

The average growth rate in the last 5 years was the fastest since 1960. Is this a structural shift or a transient phase?

Figure: Growth Rate of GDP per capita

Economy is Creating Jobs - But Not Everywhere !

Figure 1: URBAN POPULATION ... Ratio of employed people to 15 years old and older population


Figure 1: RURAL POPULATION ... Ratio of employed people to 15 years old and older population

Are We There Yet ? (2)

The Republic of Turkey has been a "developing" country from the day it established in 1923. Are getting closer to be a "developed" one?

Let's have a closer look at 1980-2006 period. The first graph compares the growth performance of the Turkish economy with the rest of the world:

Figure 1: Average Growth Rate


It is clear that after a brief period of "above-average" performance following the free market reforms in the early 80s, the Turkish economy fell into a "growth recession" through the 90s. Following the 2001 crisis, the economy has recovered considerably and experienced a 7.2% growth rate.

What is remarkable is that the acceleration in groth rate has been achieved despite the negative shocks in the terms of trade. In the early 80s, the export prices increased, on the average, 2.1% (per year) faster than import prices - which mean that by 1988, the export prices were, in cumulative terms, almost 20% higher as compared to import prices.

In the 2000s, on the other hand, due to rise in energy and commodity prices, the terms of trade have deteriorated (on the average) 1.3% per year. The cumulative change was 8% by 2006.

Asia and East Europe have suffered too, albeit less severe than Turkey. All other developing countries in Africa, Middle East, and South America have experienced a positive shock.

Figure 2: Average Change in Terms of Trade (negative numbers indicate a deterioration)


Figure 3: Average Change in Terms of Trade (negative numbers indicate a deterioration)


Therefore, it is not surprising to observe the deterioration in the current account balances of Turkey. Note that East Europe has also relied on foreign capital flows to finance its growth rate. Asia, on the other hand, has continued to increase its current account surplus thanks to rise in national savings:

Figure 4: Average Current Account Balances (negative numbers indicate current account deficits)


Figure 5: Average Savings Rate (percent of GDP)


What is important is that the Investment-growth ratio, which was peaked at the end of 90s, has declined recently and in par with other developing countries.

Figure 6: The ratio of Investment/GDP to Growth Rate (ten year moving average)

Monday, May 28, 2007

Are We There Yet?

Turkey is a developing country. We all agree on that. In her quest to become a developed country, is she getting closer to her goal? Diagrams below may give you an idea.

Using PPP GDP per capita figures, I normalized the income level of countries with respect to Turkey (i.e. by setting Turkey's income per capita as one). In the first figure, we compare the economic development of Turkey with three of her peers in the early 1900s: Greece, Portugal and Spain.

In 1913, all three were richer: Spain by 120%, Greece by 70% and Portugal by 45%. On the average, income per capita in these countries were 78 percent higher than that of Turkey.
  • Fast-forwarding to 1950, the difference is almost the same: 75%.

  • In the 50s, Turkey was able to get closer a little bit.

  • But in the 60s and 70s, Turkey was not able to keep pace with the three and fell behind.

  • In 1980, they were almost 3 times richer.

  • In the 80s, the gap shrunk again - to 2.79.

  • Following the "lost decade" of 90s (which can be characterized by an ever-lasting political and economic uncertainty in Turkey), Greece, Portugal, and Spain are 2.79 times richer.


Figure 1: Income per capita (PPP) - Turkey vs. Greece, Spain, and Portugal


The other diagrams compare Turkey with Europe, South America, Asia and Pacific.


Figure 2: Income per capita (PPP) - Turkey vs. Europe


Figure 3: Income per capita (PPP) - Turkey vs. South America


Figure 4: Income per capita (PPP) - Turkey vs. Asia


Figure 5: Income per capita (PPP) - Turkey vs. Pacific

In the last graph, we compare income per capita of Turkey with the 38 countries. It seems that we are not there yet...


Figure 5: Income per capita (PPP) - Turkey vs. Pacific

_________________________________________________
Data Set:
1. Angus Maddison (‘Monitoring the World Economy 1820-1992’, OECD 1995).
2. Penn World Table
3. World Economic Outlook Database, April 2007

Wednesday, November 22, 2006

Saturday, September 09, 2006

Turkey - Country Forecast

"Economic growth has been strong so far in 2006, but a sharp weakening of the lira in May-June, accompanied by higher inflation and monetary tightening by the Central Bank of Turkey, will lead to a slowdown in the second half of this
year and the first half of 2007. GDP growth is forecast to be 4.5% in 2006 and about 4% in 2007. " (Economist, August 21 2006).

Yogi Berra once said "Prediction is very hard, especially about the future!"

But, come on! Just look at the statistics as of Aug 15 for God's sake.

  • First quarter GDP growth rate was 6.4 percent.
  • Second quarter industrial production (released on Aug 8) is 9.3 percent (it was 3.5 percent in the first quarter).
  • Based on this information, one can easily predict that second quarter growth will be 9-10 percent.
  • This means that in the first half growth rate will be around 8 percent.
  • For the remainder of the year, the country should fall into a sudden and severe recession (that nobody expects, even the Economist) to get 4.5 percent average growth rate in 2006.
  • A more reasonable estimate (say 3-4 percent for the second half) would give us around 6 percent rate for the year.

Of course, this is the same magazine that predicted a recession in Turkey at the beginning of 2004 ...the growth rate, it turned out, ended up 9 percent.

Update (Sep 13): GDP growth: 2006Q2: 7.5%, 20061H: 7.0%

Tuesday, September 05, 2006

Is Foreign Capital Harmful For Economic Growth?

Raghuram Rajan, who is the head of research department at IMF caused quite a debate in Turkey with his recent speech at a conference in Wyoming (bad boy!). In sevral op-eds prominent Turkish economists cited that speech to prove the virtues of (semi) closed economy over an open one that allows free movement of capital.

What did Dr. Rajan said in Wyoming (home of the VP Cheney. Hmmm?)

Our conclusion is therefore that in the long run, capital account opening is unlikely to help poor countries grow by providing resources in excess of what is available in the domestic economy.

Countries that use less foreign finance, or export more savings, grow faster.

Countries that invest more grow more than countries that invest less; but it is countries that invest more and save more (that is rely less on foreign capital) that do the best of all. In fact, within countries that invest more, those that save more (and thus run lower current account deficits) grow at a rate of about 1 percent a year more than countries that save less.

We find ... that controlling for domestic savings in our baseline regression eliminates the effect of the current account on growth but controlling for investment does not.

All this suggests that domestic savings rather than foreign savings are critical for growth.

In other words, it is good to save more and invest it. (You go Robinson Cruiso!). On the other hand, if for a variety of reasons you are not able to increase your savings (which is the case in Turkey), then what is your best course of action? I say let's borrow the savings of other countries and invest it to increase production capacity (but use that money wisely because you are going to pay it back with interest). This is the second-best option and in fact only option that we face in Turkey given that we are living in a democratic society and our elected leaders are likely to be reluctant to commit suicide by forcing their constituencies to adopt a China like savings rate.

Let me give a few numbers:

  1. Between 1960 and 2005, 1 percent increase in growth, on the average, has required an investment of 4.7 percent (of gdp) investment.
  2. That meansto achieve a 6 percent growth rate, we need 27 percent investment
  3. Average savings rate in Turkey in the same period was 20 percent.
  4. If we assume that the savings rate will be the same in the future, we need 7 percent foreign capital to make up the difference.

If you do not like this scenario, you only have two alternatives:

  1. Increase savings rate through high tax rates, low government spendings, or both (and commit political suicide)
  2. Increase the productivity of the economy.

How can we raise productivity? With more competition, new technologies, new business practices. In other words establish the rule of law in the country, cut the red tape, reduce corruption, invest on the infrastructure of the country, prevent oligopolistic business practices, create a competitive business environment, and of course attract more foreign direct investment.

Until then, the country needs foreign capital to grow.
Monday, September 04, 2006

Jobless Growth in Turkey

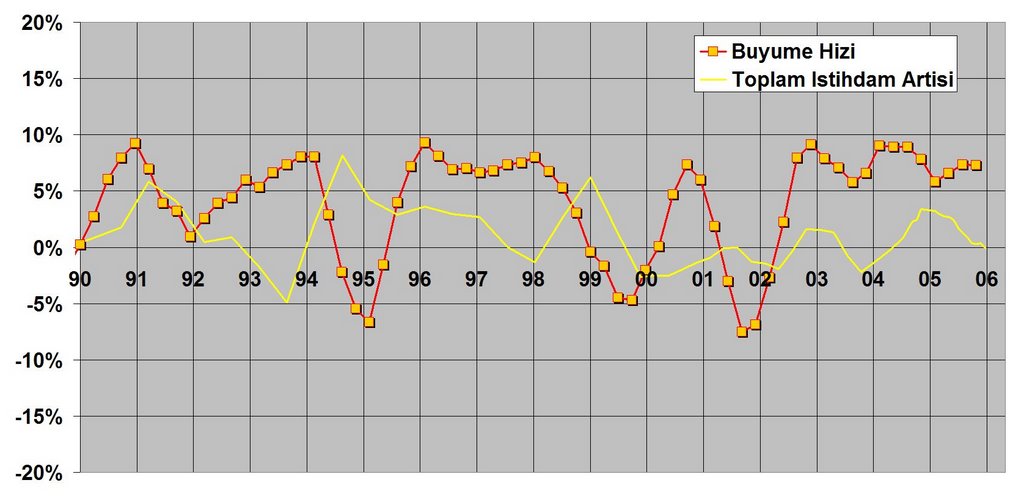
There is a widespread belief that despite the high rate of economic growth in the last five years (real gdp increased by more than 35%, on a cumulative basis, in the last 17 quarters following the deep recession in 2001), the Turkish economy has failed to create jobs to reduce unemployment rate below10%). Many pundits call this "Jobless Growth"

Let's have a closer look at the numbers: (our analysis is restricted to 1990-2006 period, since the government begun to collect its first reliable statistics on employment in Fall 1988)

In the first figure, we look at the economic growth (red line)and job growth (yellow line). Historically, the link between these two seems to be weak.


Part of the explanation may be found in the structure of employment. In the 1990s more than one third of the workforce was in the agriculture sector, although agriculture compromises less than 20% of GDP. This mismatch may weaken the link between job growth and GDP growth.

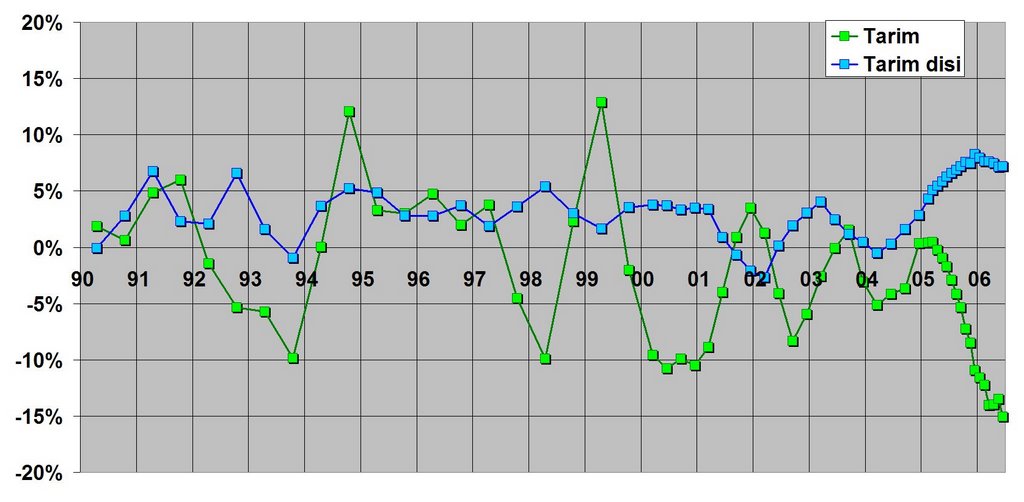
Next, we divided job growth into two parts: nonfarm employment and agricultural employment and looked at annual growth rates in the next figure (blue line for nonfarm employment).

Interestingly enough, we are witnessing the highest nonfarm employment growth rate and the lowest farm employment growth rate in the last 15 years.

Two questions come to my mind: Are we witnessing a radical structural change in the job market? Is there something wrong with the statistics on agricultural employment valid?

The numbers are suspicious for the following reason: Almost all positive growth rates in agricultural employment came when the economy is in recession: 1991, 1994, 1999, 2001. Is it possible that those people who supposedly work in the agriculture sector realy work or they just return to their villages when the economy is in trouble?

Let's look at the simple correlation between the variables, first: :

Employment Growth in Agriculture vs. Production Growth in Agriculture: 0.02
Growth in Nonfarm Employment vs. Growth in Nonfarm Production: 0.26
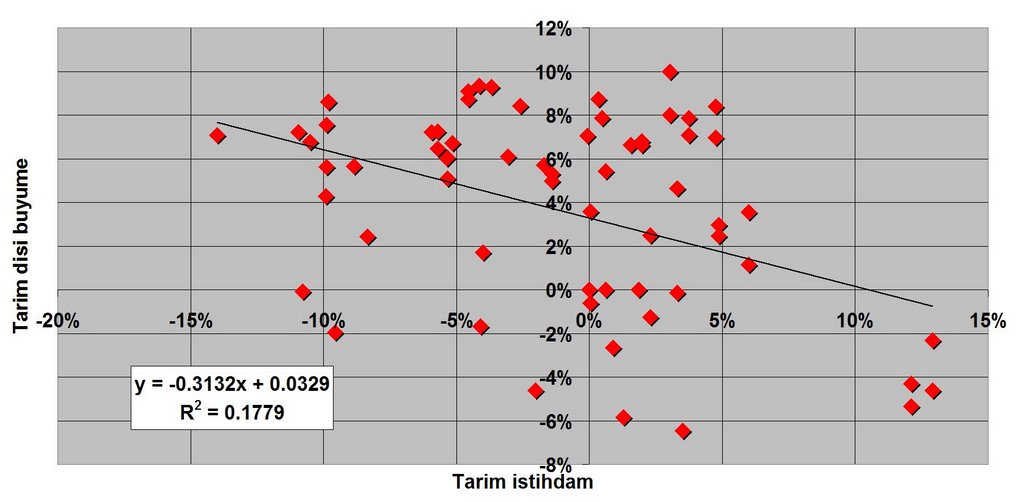
Employment Growth in Agriculture vs. Growth in Nonfarm Production: -0.42

Let's put the numbers in a chart, where this negative relationship between nonfarm production growth (y-axis) and agricultural employment growth (x-axis) is easily observable:


Lesson 1
: Better to look at nonfarm employment because there is something fishy in agricultural employment data.

In the next graph, we look at the relationship between nonfarm employment growth (blue line) and nonfarm production growth (red line). The link is more stable and significant, but still there is something wrong with the figure. In particular, look at 1994 and 1999. Although the country fell into depression in these periods, the economy continued to create nonfarm jobs!!! How can this be possible?


My explanation is the changes in the household survey (the only data source on employment in Turkey), especially in the sample size and the methodology.

The State Institute of Statistics started to conduct households surveys on a bi-annual basis in 1988. In 2000 the HH survey methodology was updated (sample size was doubled, and the coverage was extended to other regions of the country). Between 2000 and 2005 survey cycle was reducted from 6 to 3 months. In 2005 the HH survey was updated once again to make it compatible with Eurostat standards. Number of regions covered was raised from 7 to 26 and sample size by 50%. Starting in Jan2005, HH survey has conducted each month.

Lesson 2: You can rely more on 2000-2005 numbers than 1998-2000, and more on 2005- numbers than 2000-2005.

Let's focus on 2000-2006 period and update our simple correlation table:

Employment Growth in Agriculture vs. Production Growth in Agriculture: -0.40
Growth in Nonfarm Employment vs. Growth in Nonfarm Production: 0.60
Employment Growth in Agriculture vs. Growth in Nonfarm Production: -0.37
And also update the previous figure as well (nonfam job growth on the x-axis, nonfarm production growth in the y-axis):
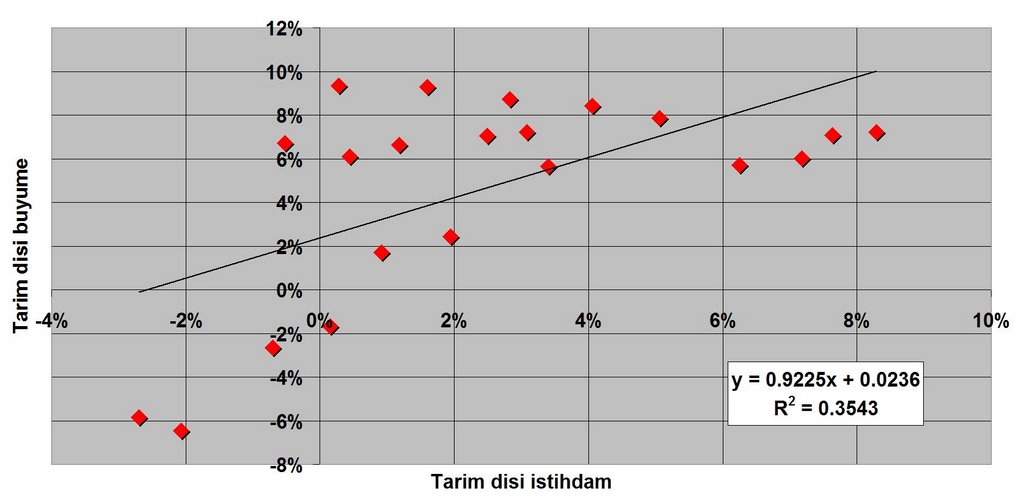
This is the picture of so-called "jobless growth".

Data Source