Google
 

Monday, June 11, 2007

McKinnon on Argentina’s Monetary Regime

"Argentina’s initial massive depreciation, as measured from the third quarter of 2001 to the second quarter of 2002, was 275 percent—as shown in figure 1. Then by mid 2003, the nominal exchange rate had bounced back somewhat to a depreciation of just 200 percent (from 3Q 2001) and has subsequently remained remarkably stable. Since 2002, the nominal exchange rate has remained at 3 pesos per U.S. dollar, ± 3 percent....If one presumed that the pre-crisis exchange rate in early 2001 was roughly at purchasing power parity, then a sustained 200 percent devaluation (the value of the dollar rises from 1 to 3 pesos) will eventually show up as a 200 percent increase in the domestic price level. Producer prices, which are more directly affected by the exchange rate, will react faster than consumer prices. And by early 2007, producer prices have already risen more than 180 percent while consumer prices rose by just 90 percent. Thus, at 3 pesos to the dollar, Argentina faces several more years of substantial inflation in its CPI before the fixed nominal exchange rate eventually ends it. "

"Korea followed a somewhat different monetary cum exchange rate policy. Following its great crisis of late of 1997-98. To be sure, Korea’s crisis was less intense than what Argentina experienced four years later — at least as measured by the initial depreciation, where the won per dollar rate rose “just” 85 percent (figure 3).... However, the big difference between the two countries in their post-crisis experiences is that Korea opted not to stabilize the nominal value of the won at a highly depreciated level, as Argentina did. Rather the Bank of Korea opted to let the won continue appreciating, albeit somewhat erratically, as shown in figure 3. "


What about Turkey? To understand the rate of change in variables, the graph below is in log terms. "Energy" represents the cost of energy imports.

Thursday, June 07, 2007

Fast and Furious !

The average growth rate in the last 5 years was the fastest since 1960. Is this a structural shift or a transient phase?

Figure: Growth Rate of GDP per capita

What Lies Beneath?

If you are looking for the culprit of Turkey's trade deficit, the figure below may give you a clue... Keep in mind that the economy contracted significantly in 1994, 1999, and 2001.

Economy is Creating Jobs - But Not Everywhere !

Figure 1: URBAN POPULATION ... Ratio of employed people to 15 years old and older population


Figure 1: RURAL POPULATION ... Ratio of employed people to 15 years old and older population

What is Wrong with Inflation?

Turkey: Finally some good news on inflation

"Turkey’s State Institute of Statistics has published the May inflation numbers. Turkish consumer prices (CPI) came out at 9.23% y/y (0.50% m/m) - below the consensus expectation of 9.6% y/y. Similarly, producer prices (PPI) were up 7.14% y/y (0.39% y/y) in May - also below the consensus expectation of 7.4% y/y. The downward surprise on CPI mostly reflects lower-than-expected food prices. Over the last couple of months food prices have surprised a bit on the upside - in May we saw a bit of a “mean-reversion” in the food prices.

Overall, this is good news and inflation should drop further in the coming months, but inflation is still likely to remain elevated and significantly above the Turkish central bank’s (TCMB) official inflation target of 4% by the end of the year. We now see inflation around 7-7½% by the end of the year. "

Is that so?

Both CPI and core CPI figures declined in May. The problem is that if we look at other "core inflation measures" like median CPI and trimmed mean, we don't observe any downward trend. On the contrary, the trend is upwards. It seems that the recent drop in inflation owes too much on volatile food prices (which happen to decrease in May).

The inflation report is at best "good news" with an asterix.

Are We There Yet ? (2)

The Republic of Turkey has been a "developing" country from the day it established in 1923. Are getting closer to be a "developed" one?

Let's have a closer look at 1980-2006 period. The first graph compares the growth performance of the Turkish economy with the rest of the world:

Figure 1: Average Growth Rate


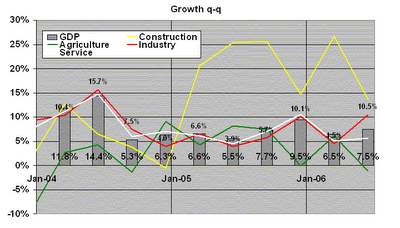
It is clear that after a brief period of "above-average" performance following the free market reforms in the early 80s, the Turkish economy fell into a "growth recession" through the 90s. Following the 2001 crisis, the economy has recovered considerably and experienced a 7.2% growth rate.

What is remarkable is that the acceleration in groth rate has been achieved despite the negative shocks in the terms of trade. In the early 80s, the export prices increased, on the average, 2.1% (per year) faster than import prices - which mean that by 1988, the export prices were, in cumulative terms, almost 20% higher as compared to import prices.

In the 2000s, on the other hand, due to rise in energy and commodity prices, the terms of trade have deteriorated (on the average) 1.3% per year. The cumulative change was 8% by 2006.

Asia and East Europe have suffered too, albeit less severe than Turkey. All other developing countries in Africa, Middle East, and South America have experienced a positive shock.

Figure 2: Average Change in Terms of Trade (negative numbers indicate a deterioration)


Figure 3: Average Change in Terms of Trade (negative numbers indicate a deterioration)


Therefore, it is not surprising to observe the deterioration in the current account balances of Turkey. Note that East Europe has also relied on foreign capital flows to finance its growth rate. Asia, on the other hand, has continued to increase its current account surplus thanks to rise in national savings:

Figure 4: Average Current Account Balances (negative numbers indicate current account deficits)


Figure 5: Average Savings Rate (percent of GDP)


What is important is that the Investment-growth ratio, which was peaked at the end of 90s, has declined recently and in par with other developing countries.

Figure 6: The ratio of Investment/GDP to Growth Rate (ten year moving average)

Monday, May 28, 2007

Are We There Yet?

Turkey is a developing country. We all agree on that. In her quest to become a developed country, is she getting closer to her goal? Diagrams below may give you an idea.

Using PPP GDP per capita figures, I normalized the income level of countries with respect to Turkey (i.e. by setting Turkey's income per capita as one). In the first figure, we compare the economic development of Turkey with three of her peers in the early 1900s: Greece, Portugal and Spain.

In 1913, all three were richer: Spain by 120%, Greece by 70% and Portugal by 45%. On the average, income per capita in these countries were 78 percent higher than that of Turkey.
  • Fast-forwarding to 1950, the difference is almost the same: 75%.

  • In the 50s, Turkey was able to get closer a little bit.

  • But in the 60s and 70s, Turkey was not able to keep pace with the three and fell behind.

  • In 1980, they were almost 3 times richer.

  • In the 80s, the gap shrunk again - to 2.79.

  • Following the "lost decade" of 90s (which can be characterized by an ever-lasting political and economic uncertainty in Turkey), Greece, Portugal, and Spain are 2.79 times richer.


Figure 1: Income per capita (PPP) - Turkey vs. Greece, Spain, and Portugal


The other diagrams compare Turkey with Europe, South America, Asia and Pacific.


Figure 2: Income per capita (PPP) - Turkey vs. Europe


Figure 3: Income per capita (PPP) - Turkey vs. South America


Figure 4: Income per capita (PPP) - Turkey vs. Asia


Figure 5: Income per capita (PPP) - Turkey vs. Pacific

In the last graph, we compare income per capita of Turkey with the 38 countries. It seems that we are not there yet...


Figure 5: Income per capita (PPP) - Turkey vs. Pacific

_________________________________________________
Data Set:
1. Angus Maddison (‘Monitoring the World Economy 1820-1992’, OECD 1995).
2. Penn World Table
3. World Economic Outlook Database, April 2007

Tuesday, March 06, 2007

It's the oil, stupid!

Turkey has been experiencing a significant trade deficit since 2003. Is it because the country imports too much and/or exports too little due to appreciation of the local currency?

Two tables below explain the problem. The main culpit is the high energy prices. The ratio of manufacturing exports to intermediate goods has never been higher. Ditto for the export/import ratio -- IF ONE EXCLUDES ENERGY BILL.


If there we no change in the energy prices, the ratio of exports to imports would be much better:

Figure: The ratio of exports to imports under 2000 prices

The Turkish Economy - Recent Developments (2)

Public borrowing constitutes a heavy burden on the financial system. One reason is the under-developed nature of the Turkish capital market. Financial deepening of the system as measured by broad money supply M2Y (which comprised of both domestic currency and foreign exchange deposits) was 28 percent of GDP in 1989 and stayed around 30-35 percent throughout 1990s despite financial liberalization in 1989. Following the economic reform program in 2001, M2Y/GDP ratio has risen gradually and reached to 50% in 2006. The ratio of the domestic debt to M2Y has declined, but it still above the pre-2001 level. Domestic cash debt (i.e. debt excluding to public institutions) is 74%. Net domestic borrowing is almost nill, thanks to fiscal austerity and privatization revenues. Gross domestic borrowing, on the other hand, is at pre-1994 level.


The Turkish Economy - Recent Developments (1)

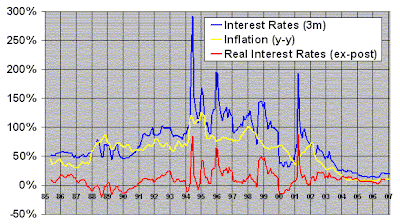
The fragility of the economy to external shocks was tested in May 2006, when a turmoil in the global financial markets caused local interest rates to rise from 13 percent to 23 percent coupled with 30 percent devaluation in Turkish Lira. The Central Bank responded with a 425 basis point interest hike. After a brief spike to double digits, inflation has returned to pre-May levels at 9 percent. The Lira has recovered most of its previous loses towards the end of the year. Yields on short term treasury, however, remain high and real interest rates, 12 percent at the start of 2007, are still 600 basis points above pre-May levels.


Wednesday, November 22, 2006

Tuesday, November 14, 2006

Decomposition of Capital Inflows and Interest Rates in Turkey


Graphics below show
  • the total capital inflows to Turkey (as % of GDP, 12 month moving average, left axis),
  • decomposition of inflows (as % of GDP, 12 month moving average, left axis)
  • the real interest rates in Turkey (in $ terms, ex-post, 12 month moving average, including currency appreciation, in right axis).


Notes:
(1) interest rate: dollar terms, ex-post, right axis
(2) capital flow: as % of gdp, left axis
(3) government borrowing (% of gdp, left axis, bonds issued abroad, IMF credits, other credits --- excluding Treasury domestic borrowing securities)
(4) hot money linked to interest rates (% of gdp, left axis, Treasury domestic borrowing securities, short term borrowing of banks, short term borrowing of other sectors, deposits, net errors and omissions, excluding stock purchases)

Sunday, November 12, 2006

The Outlook

The graph below depicts the 3-month moving average changes in exports, imports, and industrial production.

Following the interst hikes of the Central Bank in June, there are signs of slowdown in consumption. The industrial production piked in July and has been gradually lost momentum ever since. If the exports remain strong, the economy may end up with a 5-6 percent growth for the second half of the year. Otherwise I expect a 3-4 % growth.

The History of TL/$ Exchange Rate

The graph below shows the TL/$ exchange rate (in today's prices) for the last 40 years.

It is funny to see that the current value of TL is the same as what it was in 1965.
Somethings Never Change in Life.