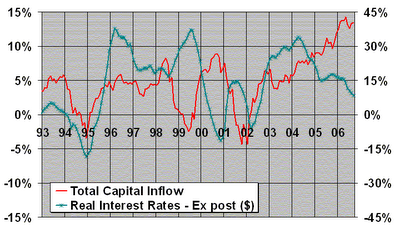
Google
 

Wednesday, November 22, 2006

Tuesday, November 14, 2006

Decomposition of Capital Inflows and Interest Rates in Turkey


Graphics below show
  • the total capital inflows to Turkey (as % of GDP, 12 month moving average, left axis),
  • decomposition of inflows (as % of GDP, 12 month moving average, left axis)
  • the real interest rates in Turkey (in $ terms, ex-post, 12 month moving average, including currency appreciation, in right axis).


Notes:
(1) interest rate: dollar terms, ex-post, right axis
(2) capital flow: as % of gdp, left axis
(3) government borrowing (% of gdp, left axis, bonds issued abroad, IMF credits, other credits --- excluding Treasury domestic borrowing securities)
(4) hot money linked to interest rates (% of gdp, left axis, Treasury domestic borrowing securities, short term borrowing of banks, short term borrowing of other sectors, deposits, net errors and omissions, excluding stock purchases)

Sunday, November 12, 2006

The Outlook

The graph below depicts the 3-month moving average changes in exports, imports, and industrial production.

Following the interst hikes of the Central Bank in June, there are signs of slowdown in consumption. The industrial production piked in July and has been gradually lost momentum ever since. If the exports remain strong, the economy may end up with a 5-6 percent growth for the second half of the year. Otherwise I expect a 3-4 % growth.

The History of TL/$ Exchange Rate

The graph below shows the TL/$ exchange rate (in today's prices) for the last 40 years.

It is funny to see that the current value of TL is the same as what it was in 1965.
Somethings Never Change in Life.